
Retonomix - Retail Performance Management Methodology

Retonomix is a practical methodology for improving retail performance through systematic process analysis, KPI management, deviation analysis, management decision-making, and continuous improvement.

Retonomix - Retail Performance Management Methodology
BOOK RELEASE DATE

AVAILABLE TO ALL CUSTOMERS AND USERS OF THE SYSTEM

What can we offer for your retail business?

Retail Business Optimization: Make Decisions That Improve Business Results

Retonomix helps retail companies determine which changes in assortment, pricing, promotions, inventory, stores and workforce can deliver the greatest business impact. The approach connects processes, performance indicators, deviations, management decisions and improvement actions into one continuous performance management cycle. Decisions are evaluated not only through operational KPIs, but also by their impact on margin, profit, EBITDA, revenue and working capital.
What do you get?

  • Clear Priorities for Management Decisions Clear Priorities for Management Decisions

    A clear understanding of which deviations and business issues have the greatest impact on performance and require management attention first.

  • A Direct Link Between Processes and Business Results A Direct Link Between Processes and Business Results

    Understand how changes in assortment, pricing, inventory, stores and workforce affect margin, profit, EBITDA and working capital.

  • A System for Managing Deviations A System for Managing Deviations

    A structured mechanism for regularly identifying, analyzing and prioritizing deviations, enabling faster transition from problem detection to concrete action.

  • Control Over Management Decisions Control Over Management Decisions

    Transparent monitoring of corrective actions, with a clear view of which decisions have been made, implemented and require further management attention

  • Control of Actual Business Results Control of Actual Business Results

    The ability to evaluate whether implemented changes have improved process performance and delivered a measurable economic impact on the business.

Retail Performance Analysis: Understand What Is Changing and Why

Retail performance analysis should do more than report sales, margin, inventory or store KPIs. Its purpose is to help management understand how the business is performing as a system, where material deviations are developing and which factors are responsible for the change. In a complex retail organisation, financial results are shaped by multiple interconnected processes. Sales depend on customer traffic, conversion, basket size, assortment, pricing and stock availability. Gross margin depends on both margin rates and sales mix. Inventory affects availability, working capital and markdown risk. Store productivity is influenced by demand, staffing, execution and local operating conditions. Looking at these areas independently can identify symptoms. It does not necessarily explain causes.

What do you get?

  • A Systemic View of the Business A Systemic View of the Business

    Sales, customers, assortment, inventory, stores, operations and financial results are analysed as interconnected processes that collectively shape overall business performance.

  • Focus on Critical Deviations Focus on Critical Deviations

    Retonomix helps distinguish material performance issues from normal fluctuations, directing management attention towards deviations that have the greatest impact on business results.

  • From KPIs to Root Causes From KPIs to Root Causes

    Analysis does not stop at identifying a change in performance. Retonomix helps determine where the deviation originated, which factors contributed to it and where further investigation should focus.

  • From Analysis to Management Action From Analysis to Management Action

    Identified issues become the basis for specific decisions and corrective actions. Their execution and impact on performance can be monitored within a continuous management cycle.

  • Methodology Supported by Automation Methodology Supported by Automation

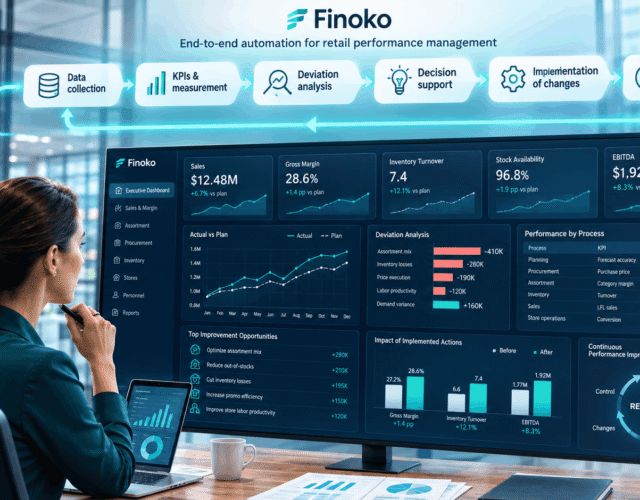
    Retonomix defines the performance management logic, while Finoko automates data collection, KPI calculation, deviation detection and the preparation of management information.

Why should you choose our company's services?

  • Connected Business Performance Model

    A structured view of how sales, customers, assortment, inventory, stores, operations and financial results interact and influence overall performance.

  • KPI and Performance Indicator Framework

    A defined set of KPIs and diagnostic metrics linked to key retail processes, helping management evaluate performance consistently across the business.

  • Deviation and Root-Cause Analysis Model

    A framework for identifying significant deviations, tracing them to underlying drivers and determining which issues require management attention first.

  • Management Action and Control Framework

    A structured process for turning analytical findings into corrective actions, assigning responsibility and monitoring implementation and outcomes.

  • Automated Performance Monitoring

    Automated data consolidation, KPI calculation, deviation detection and management reporting supported by Finoko and existing business data sources.

Retail Sales Forecasting and Planning: Managing What Happens Next

Retail sales forecasting is not simply an attempt to predict future revenue. Its real management value lies in helping a retail business understand how current trends, operational decisions and changing market conditions may affect future sales, demand, inventory, gross margin and profit. For retailers, this means moving beyond a static annual budget towards a management process in which forecasts are regularly updated as new information becomes available. A useful forecasting system connects actual business performance with expected outcomes. It allows management to assess how changes in pricing, assortment, stock levels, promotional activity, store openings, operating costs and other business drivers may affect future results. The objective is not to eliminate uncertainty. It is to make uncertainty more visible, measurable and manageable.

What do you get?

  • Better Visibility into Future Performance Better Visibility into Future Performance

    Management sees not only current results but also expected trends in sales, demand, inventory, gross margin and profit, enabling earlier identification of risks and timely action.

  • Better-Informed Management Decisions Better-Informed Management Decisions

    Scenario modelling helps assess the potential impact of changes in pricing, assortment, inventory, promotions, costs and store network development before decisions are implemented.

  • Aligned Business Plans Aligned Business Plans

    Sales, purchasing, inventory and financial plans are connected through a consistent management logic, reducing discrepancies between functions and creating a shared view of expected business performance.

  • Continuously Updated Plans Continuously Updated Plans

    Forecasts are revised as new data becomes available, allowing the business to respond faster to changes in demand and performance instead of waiting for the end of a reporting or budget period.

Do you want to work with us?

Don’t let financial problems get in the way of your restaurant’s success. Use our cutting edge software solutions and expertise today to learn how we can help you make informed financial decisions, improve profitability and ensure a prosperous future for your business.

Fill in the form and we will contact you within one working day.

    Your name

    Your phone

    Your city


    By clicking the button, you agree to processing of personal data according to privacy policy

    Read our articles

    Inventory & Supply How can retailers manage supplier order multiples without tying up too much working capital or risking stockouts?

    How can retailers manage supplier order multiples without tying up too much working capital or risking stockouts?

    This article explains how pack constraints affect replenishment and how to calculate purchase quantities from net requirements. It shows managers how to distinguish order uplift from excess stock, investigate causes, choose supplier or replenishment changes, and measure effects on inventory, availability and sales.

    Inventory & Supply How can retailers tell whether inventory is tying up working capital unnecessarily?

    How can retailers tell whether inventory is tying up working capital unnecessarily?

    Inventory aging shows how long current stock has remained unsold and how its value is distributed across age groups. Read these signals alongside demand, seasonality, replenishment plans, and availability. Managers can then investigate slow-moving stock, choose a response, and measure its effect on margin, availability, and aged-stock value.

    Inventory & Supply How can retailers choose an order quantity that protects product availability without tying up excessive working capital?

    How can retailers choose an order quantity that protects product availability without tying up excessive working capital?

    This article explains how to calculate replenishment needs using demand, lead time, safety stock, inventory position and supplier constraints. It shows where economic order quantity can help, which indicators to monitor, and how managers can investigate deviations and measure the effect of changes.

    Pricing & Promotion How can a retailer tell whether its prices are correctly positioned against competitors?

    How can a retailer tell whether its prices are correctly positioned against competitors?

    Retail Price Index measures relative price position, but its management value depends on product comparability, target price architecture, and careful interpretation of deviations. Used properly, it helps managers identify where pricing differs from strategy, investigate underlying causes, decide whether intervention is required, and measure the resulting impact on demand, sales, gross margin, and overall pricing performance.

    Sales & Customer Performance Why can retail sales grow while gross profit barely improves?

    Why can retail sales grow while gross profit barely improves?

    Sales mix shows how revenue is distributed across categories, products, stores, channels, and promotional states, revealing whether growth comes from economically stronger or weaker sales. By connecting mix changes with margin, availability, assortment, pricing, promotion, and inventory, managers can identify deviations, investigate causes, and decide which retail process should change to improve overall economic performance and profitability sustainably over time.

    Inventory & Supply How can retailers tell whether sales growth comes from stronger existing stores or simply from network expansion?

    How can retailers tell whether sales growth comes from stronger existing stores or simply from network expansion?

    Like-for-like (LFL) analysis compares performance across a consistent base of stores, helping management separate organic growth from openings, closures, and major format changes. Used with transactions, average transaction value, pricing, assortment, and availability data, LFL becomes more than a KPI: it helps identify deviations, test causes, guide decisions, and measure economic effects.

    We invite you to the conference

    We invite you to the conference

    As part of the conference, we will make a presentation on the features of restaurant management in a modern hotel

    Process Analysis

    RETONOMIX starts by analysing the key business processes of a retail company, including planning, purchasing, assortment management, inventory, sales and operations. The objective is to understand how business results are generated, which factors influence them, and where efficiency losses occur. This approach shifts the focus from analysing individual metrics to managing processes as an interconnected system.

    Process Analysis

    Defining Process Performance Indicators

    For each key process, RETONOMIX defines performance indicators that provide an objective view of its effectiveness. Operational metrics are linked to business outcomes such as sales, margin, inventory turnover, stock availability and other relevant KPIs. This creates a structured performance measurement system that shows not only the final result, but also how efficiently the underlying process is performing.

    Defining Process Performance Indicators

    Variance Analysis and Control

    Once the relevant indicators are defined, RETONOMIX establishes a systematic approach to analysing variances between actual results and planned, target or benchmark values. The focus is not on identifying every deviation, but on detecting material and recurring variances that can significantly affect financial and operational performance. This allows management attention to be concentrated on the issues that matter most.

    Variance Analysis and Control

    Decision-Making Based on Key Variances

    Key variances become the basis for management decisions. RETONOMIX helps identify the underlying causes, assess their impact on business performance and determine appropriate corrective actions. Decisions are therefore based not simply on large volumes of data, but on the factors that have the greatest influence on sales, profitability, inventory and process efficiency. This improves both the speed and quality of management decisions.

    Decision-Making Based on Key Variances

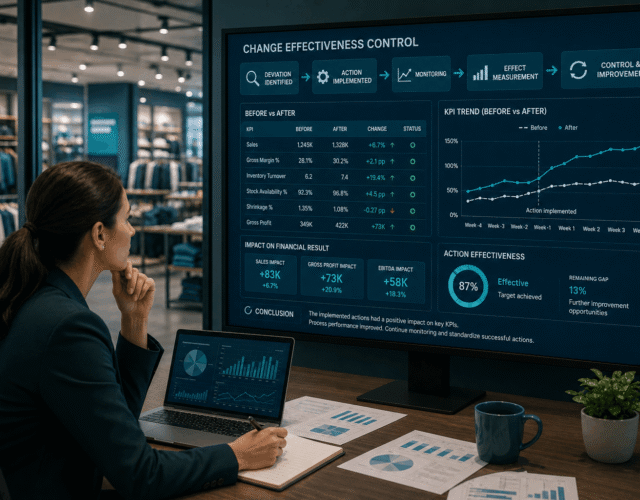
    Measuring the Effectiveness of Changes

    After corrective actions are implemented, RETONOMIX measures their actual impact on business performance. Each change is evaluated using the same performance indicators that identified the original issue, allowing performance to be compared before and after the intervention. This creates a continuous management cycle: decisions are implemented, their effectiveness is measured, recurring deviations are identified, and processes are progressively improved.

    Measuring the Effectiveness of Changes

    Automation Powered by Finoko

    Finoko provides the technology layer supporting the entire management cycle: data collection and consolidation, KPI calculation, variance identification and analysis, management reporting, decision support and monitoring of improvement results. RETONOMIX therefore combines a process-management methodology with a technological platform to create a continuous management loop: data → performance indicators → variances → decisions → actions → results.

    Automation Powered by Finoko